Program Overview
Donated Drug Reporting Templates to Support Neglected Tropical Disease (NTD) Program Implementation — WHO SMART Guidelines approach.
1. Program Name
Donated Drug Reporting Templates to Support Neglected Tropical Disease (NTD) Program
2. Sponsoring Organization(s)
John Snow, Inc. [link] and Standard Co [link], with financial support from the Bill & Melinda Gates Foundation [link], conducted an assessment of the tools and processes used to manage, direct, use, report, and store donated medicines used for Neglected Tropical Disease (NTD) control and elimination programmes for the five PC-NTDs.
3. Geographic Coverage
While this project focused on evaluating the people, systems, and processes used to track last mile supply chain for Mass Drug Administration (MDA) donated medicines in eight priority countries (DRC, Ethiopia, Kenya, Madagascar, Mozambique, Nigeria, Tanzania, and Uganda), the recommendation templates are applicable for reporting inventory of MDA donated medicines in any country with considerations for unique country context.
4. Target Population
The target population for this tool is national NTD Program Managers, implementing NGO partners, and project sponsors. The timely reporting of data on donated medicines received, used, wasted, expired, and remaining, helps to ensure that the production and distribution of new medicines are delivered to sites around the world for distribution to endemic communities in the appropriate quantities.
Alignment with WHO Smart Guidelines
5. WHO Recommendations for NTDs
In 2022, the World Health Organization (WHO) published the "Standard Operating Procedures for Supply Chain Management of Health Products for Neglected Tropical Diseases Amenable to Preventive Chemotherapy." [link] This document provides detailed procedures covering various aspects of supply chain management, including:
- Forecasting and Quantification: Accurate estimation of medicine requirements to prevent shortages or overstocking.
- Inventory Management: Systematic tracking of stock levels to maintain optimal inventory.
- Storage and Distribution: Proper storage conditions and timely distribution to ensure medicine efficacy.
- Reverse Logistics: Processes for handling and reporting unused or expired medicines.
The mechanism for reporting medicines is through the Joint Application Package (JAP) [link]. This package is a collection of forms and includes forms for reporting on medicines delivered through the Joint Reporting Form (JRF), and medicines needed for future treatments through the Joint Request for Select Medicines (JRSM).
Logistics Indicators for NTD Medicines and Health Products – Last Mile
(National and Subnational Levels)
Source: World Health Organization (2025). Routine health information system and health facility and community data for neglected tropical diseases: last-mile logistics information system for medicines and health products. Geneva: WHO. [ISBN: 978-92-4-011158-5] [link]
| No. | Indicator | Levels | Definition | Formula / Calculation | Disaggregation | Data Elements |
|---|---|---|---|---|---|---|
| 1 | Inventory reconciliation | Community, Health Facility, Subnational, National | Compares theoretical balance with actual stock on hand. | Physical count / Theoretical balance × 100 |
By product name, type, NTD, and administrative unit | 8, 1, 2, 5, 6 |
| 1b | Theoretical balance | Health Facility | Calculated stock level based on opening balance and number of people treated. | Opening balance + Qty received – (No. treated × Avg dosage) – Reported expiry/loss – Peer transfer |
By product name, type, NTD, and administrative unit | 1, 2, 5, 6 (Source: HMIS or MDA registers) |
| 2 | Stock-out rate | Health Facility, Subnational, National | Percentage of time in a reporting period that an item is out of stock. | (Days stocked out / Days in reporting period) × 100 |
By product name, type, NTD, and administrative unit | 9 |
| 3 | Forecast accuracy | Health Facility, Subnational, National | Measures how closely forecasts match actual consumption. | (1 – (|Forecasted – Actual| / Actual)) × 100 |
By product name, type, disease, and administrative unit | 4 |
| 4 | Order fill rate | Health Facility, Subnational, National | Compares quantity received with quantity requested. | (Quantity requested / Quantity received) × 100 |
By product name, type, disease, and administrative unit | 2 |
| 5 | % Expired and/or discarded medical products | Health Facility, Subnational, National | Proportion of wasted or expired medical products compared to total stock. | (Expired or discarded qty / Total stock) × 100 |
By product name, type, NTD, and administrative unit | 8, 5 |
| 6 | % Lost, damaged, or unaccounted medical products | Health Facility, Subnational, National | Proportion of lost or damaged medical products compared to total stock. | (Lost or damaged qty / Total stock) × 100 |
By product name, type, NTD, and administrative unit | 8, 6 |
| 7 | Stocked according to plan (non-PC supplies) | Health Facility, Subnational, National | Percentage of facilities maintaining stock within defined minimum/maximum levels (typically 1–3 months supply). | Stock on hand / Average monthly consumption |
By product name and type | 8, 4 |
| 7a | Average monthly consumption | Health Facility | Average consumption for each product over the last 3 months. | Quantity consumed in last 3 months / 3 |
By product name, type, disease, and administrative unit | 4 |
| 8 | Stocked according to plan (PC supplies) | Health Facility, Subnational, National | Percentage of facilities maintaining stock within 90–110% of forecasted need (for PC products). | Stock on hand / Forecast for MDA × 100 |
By product name and type | 8, 11 |
6. Digital Adaptation Kit (DAK) Components
Functional & Non-functional Requirements
Functional requirements

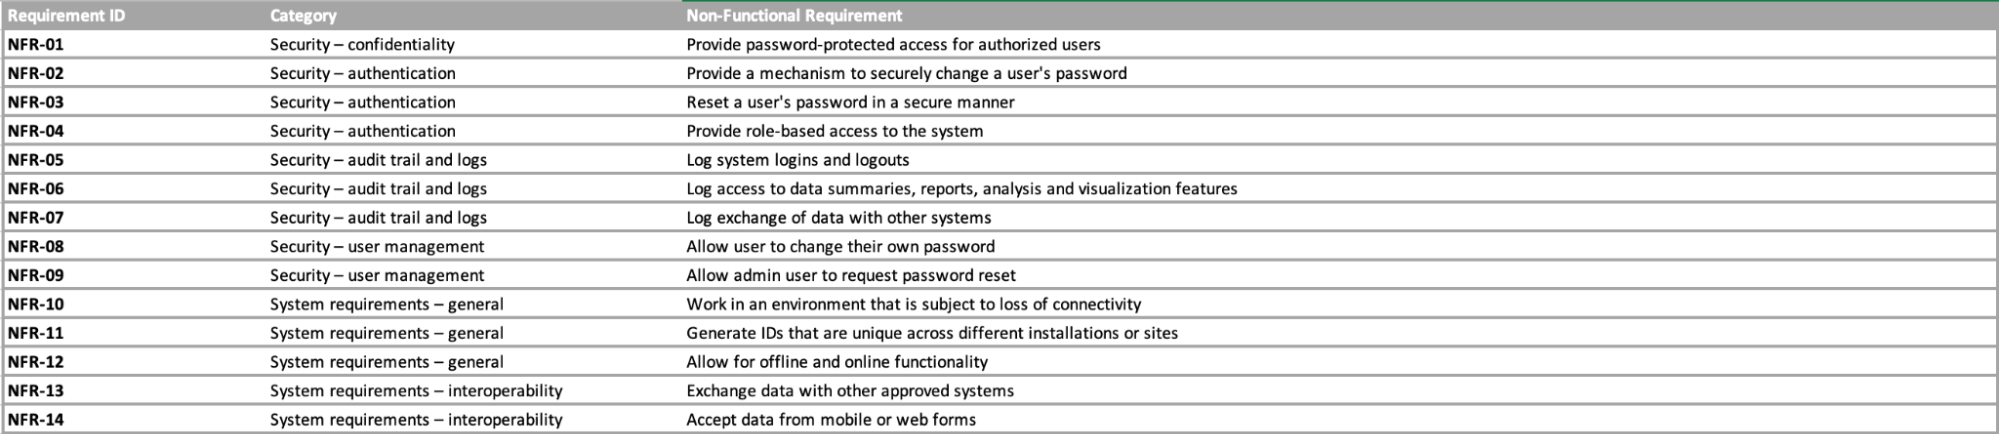
Non-functional requirements
Data Models and Exchange
Actors — entities that interact with the system, derived from business requirements
| Name | Administrative level | Description |
|---|---|---|
| Community member | Community | Target for MDA treatment |
| Community Health Worker (CHW) | Community | Distribute MDA and report data associated with treatments delivered. The system could be implemented at this level. |
| District Health Worker | District | District is the level of reporting treatments on annual reporting forms. This is the most likely level of implementing this system given the resources available at this level. |
| NTD Program Manager | National | Collect data from all districts and report these data on annual reporting forms. National level could produce reports from data reported by either community or district level. |
| WHO Country Office | National | Support national programs to complete annual reporting forms. Would have limited impact on this system. |
| WHO Regional Office | Regional | First review of annual reporting forms. If this level was given access to data collected by this system, annual reporting forms could be pre-populated through integration. |
| WHO Central Office | Global | Final review of drug donation request. Would have limited use for this system. |
| Pharmaceutical company | Global | Integration with this system would allow for early reporting of drugs used, wasted, and remaining. These data would improve forecasting for manufacturing. |
| International shipment company | Global | Would have limited impact on this system. However, the shipping information is available for integration with national systems. |
| Implementing partner | Global | Implementing partners would have no role in using this system. However, if they were given access to these data they too would have improved visibility on inventory and expiration. |
List of indicators across multiple tools
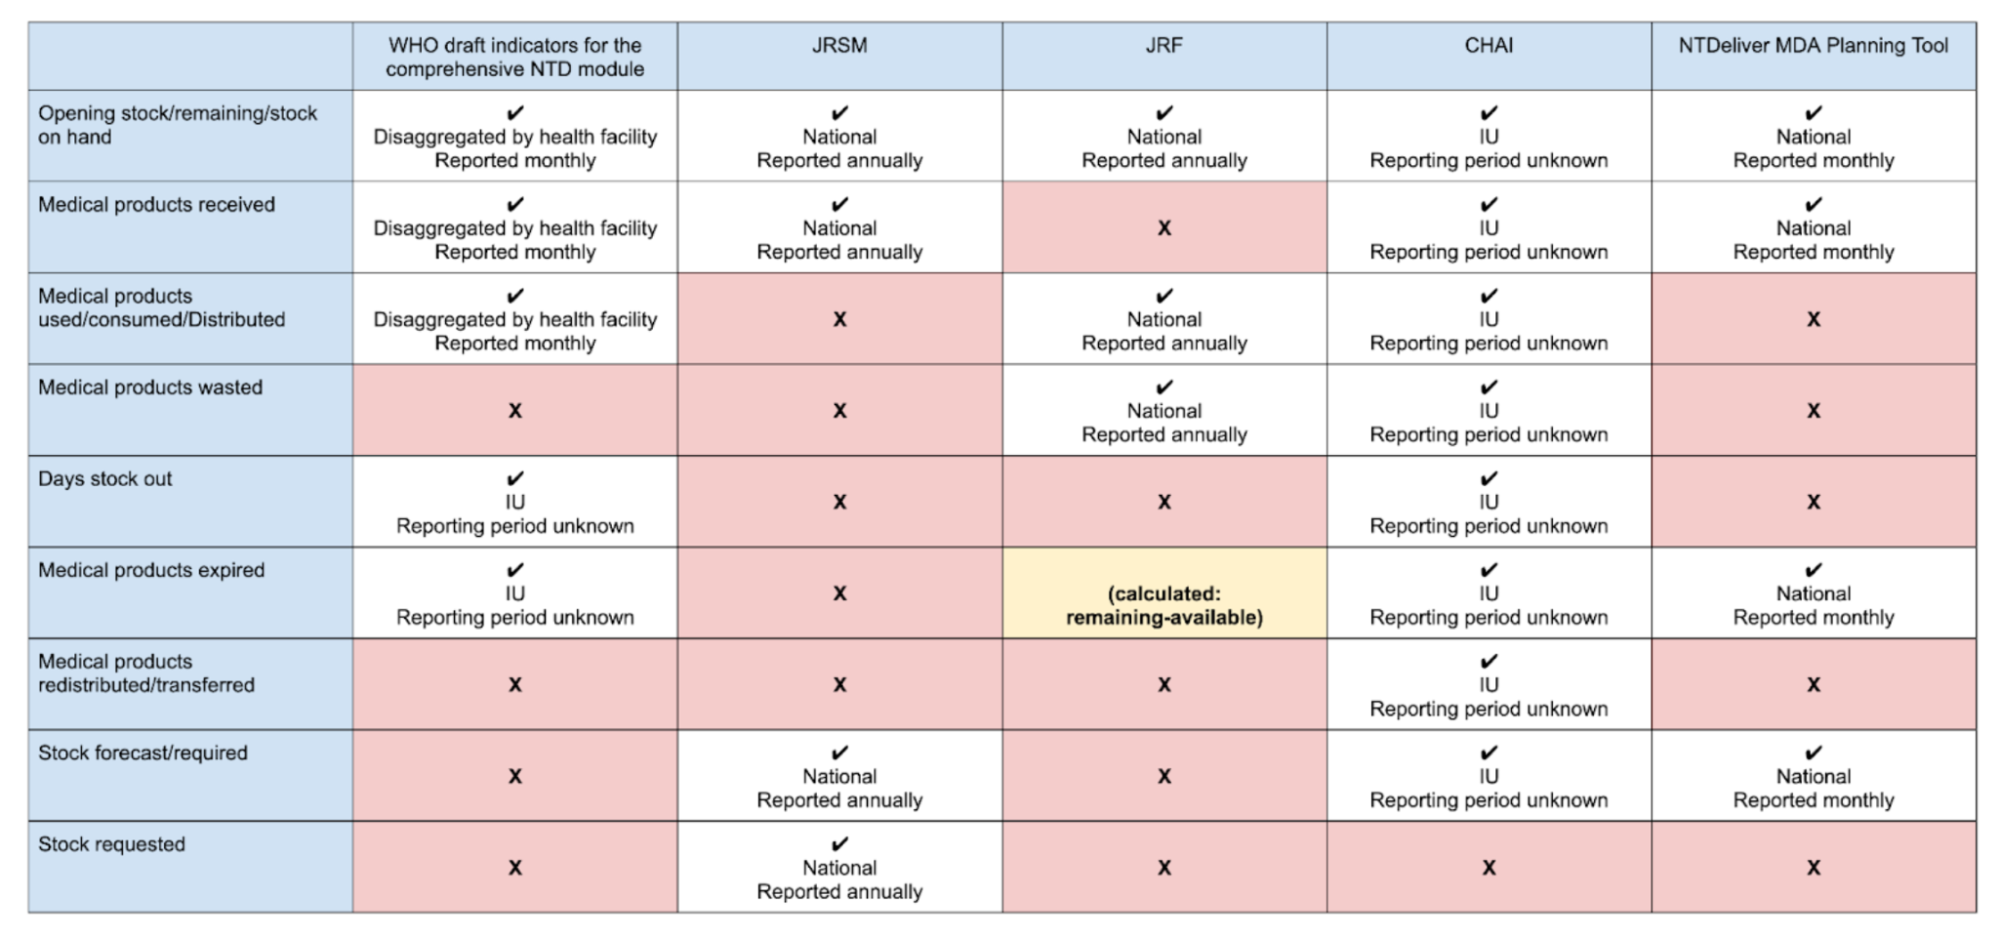
Reference: Data dictionary for supply reporting used in Kenya
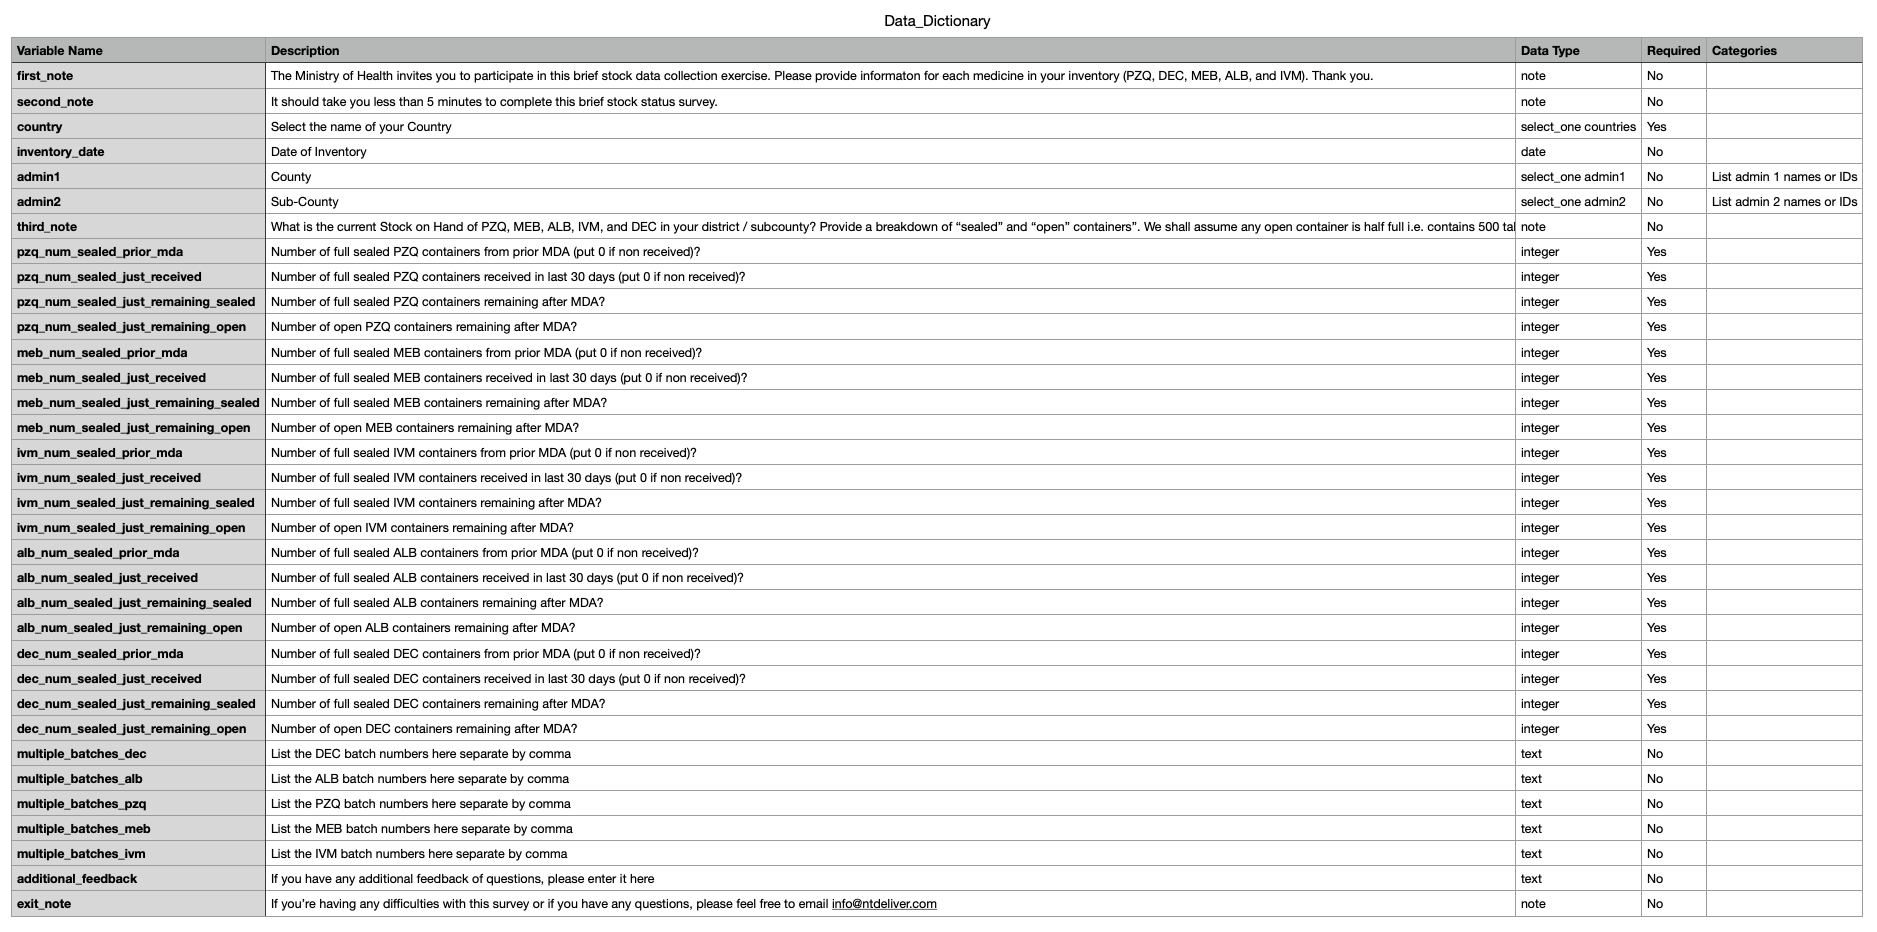
Web annex A1: Data dictionary csv · Web annex A2: Data dictionary JSON
Workflows & Business Processes
The first mile refers to the initial stages of the supply chain, from the pharmaceutical manufacturers or donors to the national or regional distribution centers. For NTD programs, first mile supply chain processes can be tracked through NTDeliver [link].
The last mile refers to the final stages of distribution, from national storage facilities to the community-level health workers or end-users. The activities and challenges associated with the last mile are the focus of this project and associated tools.
Key Activities:
- Transport to Regional & Local Distribution Points:
- National storage centers distribute medicines to regional or district health offices.
- Community-Level Distribution (MDA Campaigns):
- Community drug distributors (CDDs), often volunteers, administer medicines directly to at-risk populations through door-to-door, school-based, or health center campaigns.
- Real-time tracking and paper-based or digital recording ensure dosage compliance.
- Reverse Logistics & Waste Management:
- Expired or unused drugs are collected, stored, and expired medicines are safely disposed of.
Weak monitoring and reporting systems can lead to stockouts or over-distribution of medicines. Most often, the medicines used for MDA campaigns are not tracked using national logistics management information systems as they move from ports of entry, to central storage, and, ultimately, out to endemic communities.
General data flow at national and global level
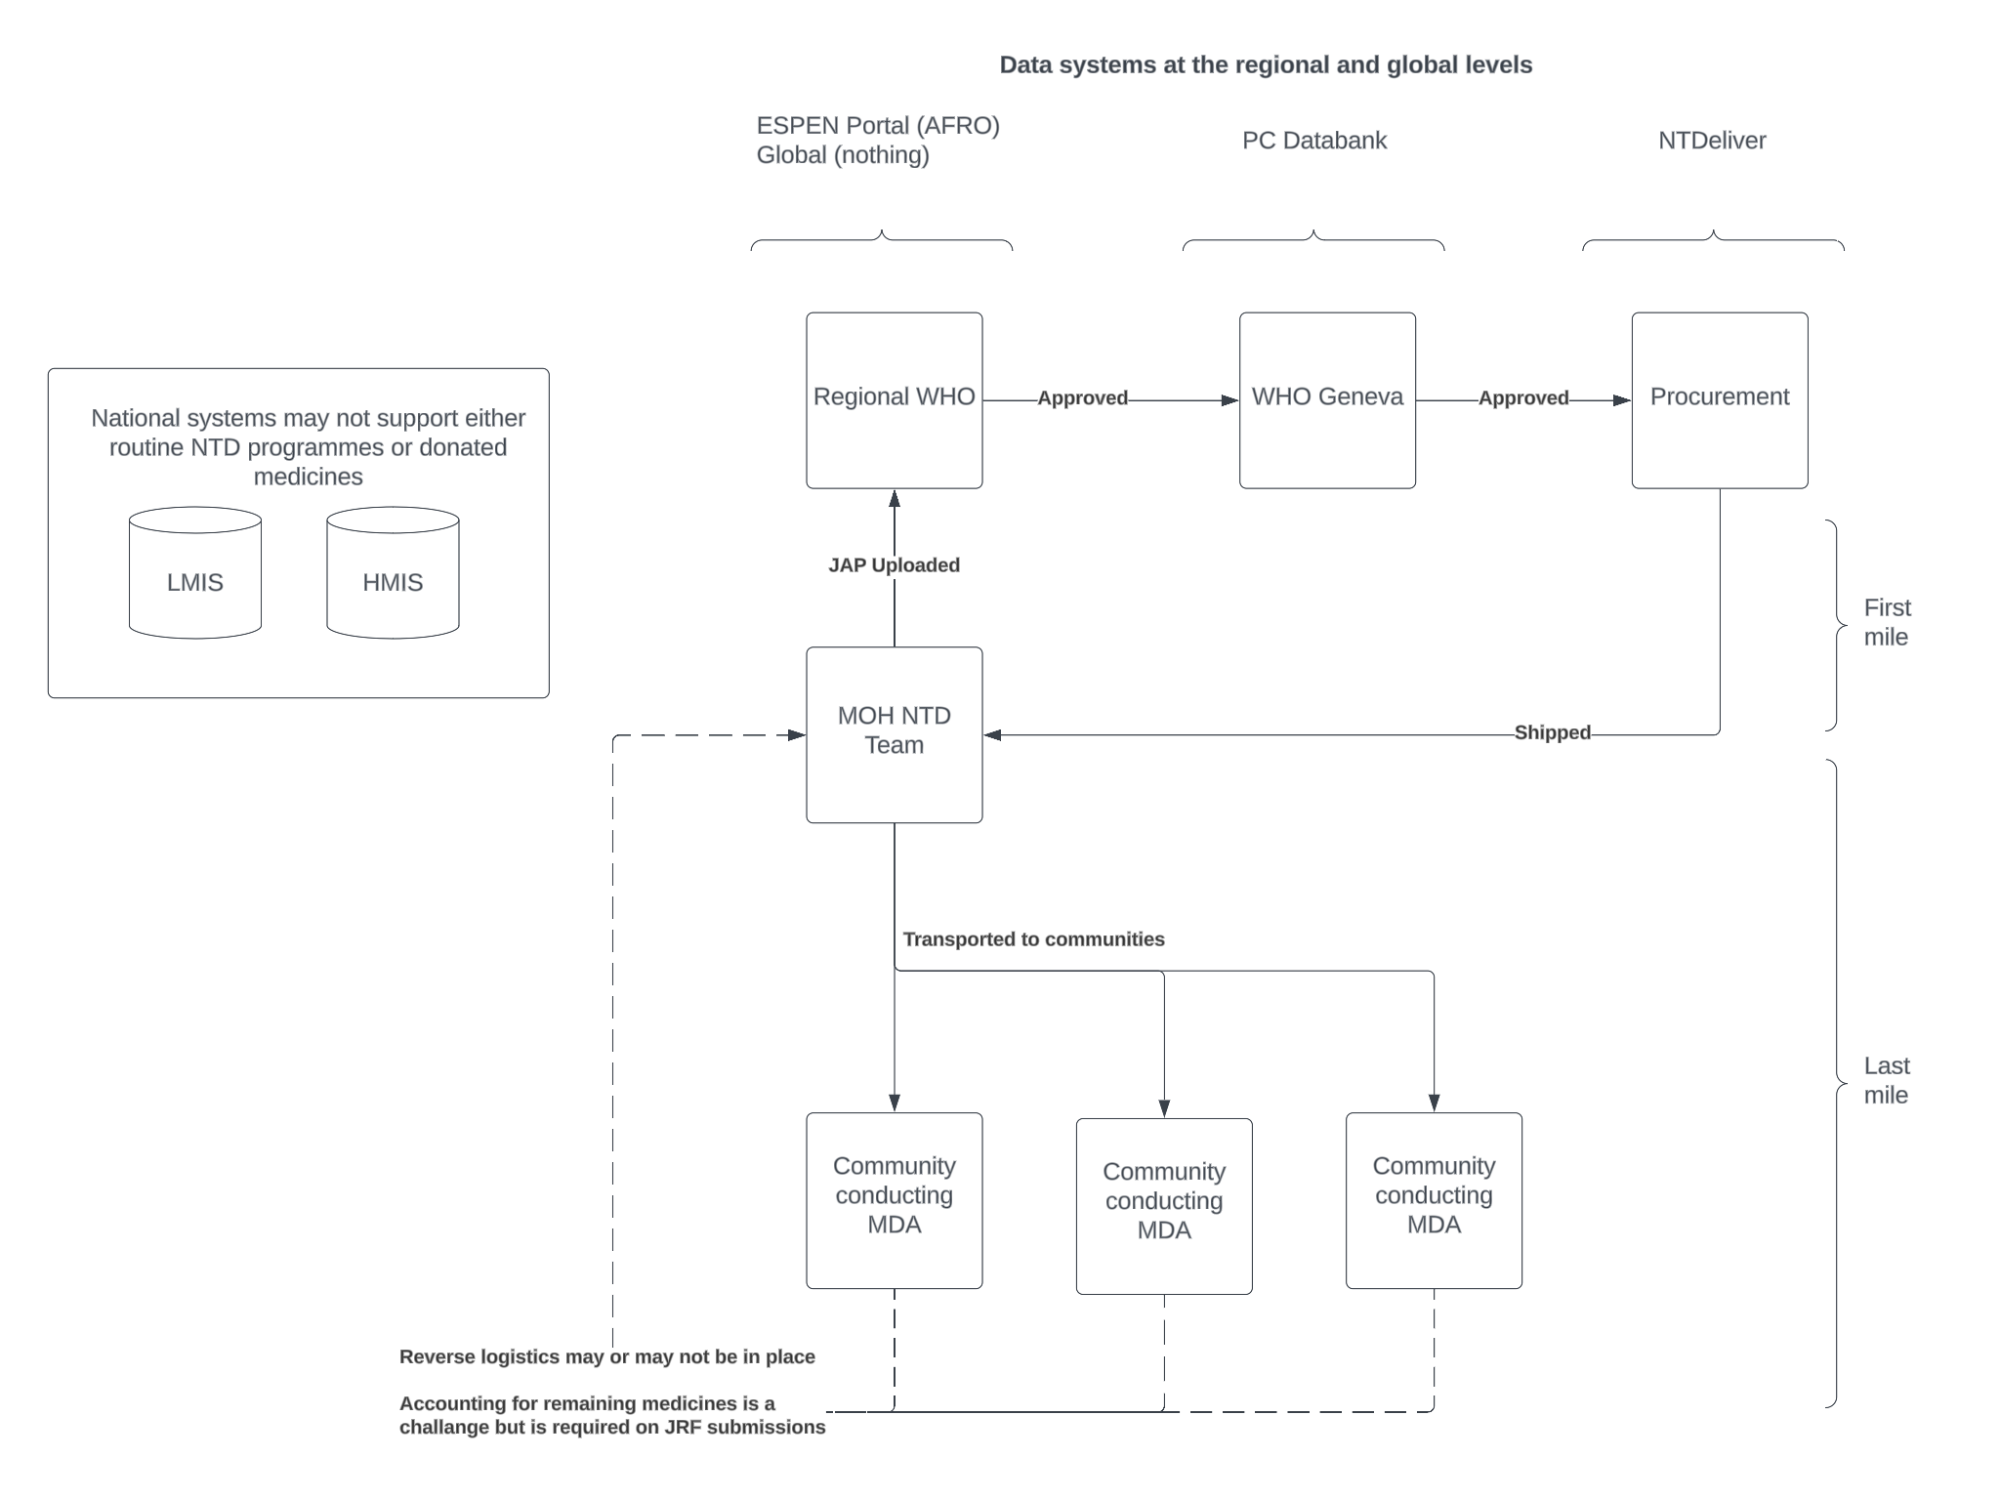
The tools provided here support the electronic submission of drug distribution during, or immediately following the MDA to a central database where these data can be accessed by all key actors and used for program management, reporting, and planning.
Data Management & Decision Support
7. Data Collection & Reporting
It is recommended that data are reported from whatever level is feasible given literacy, human resource constraints, and infrastructure constraints.
Community level
Ideally, data on MDA medicines distribution would be submitted from endemic communities on a daily basis. This would allow program managers and supervisors to monitor the progress of MDA and to make critical decisions when inventory deficits and surpluses need to be moved around.
Sub-district or district level
When community level reporting is not feasible, reporting would move to a higher administrative level, which would reduce the number of reporters, but also limit what actions could be taken with these data.
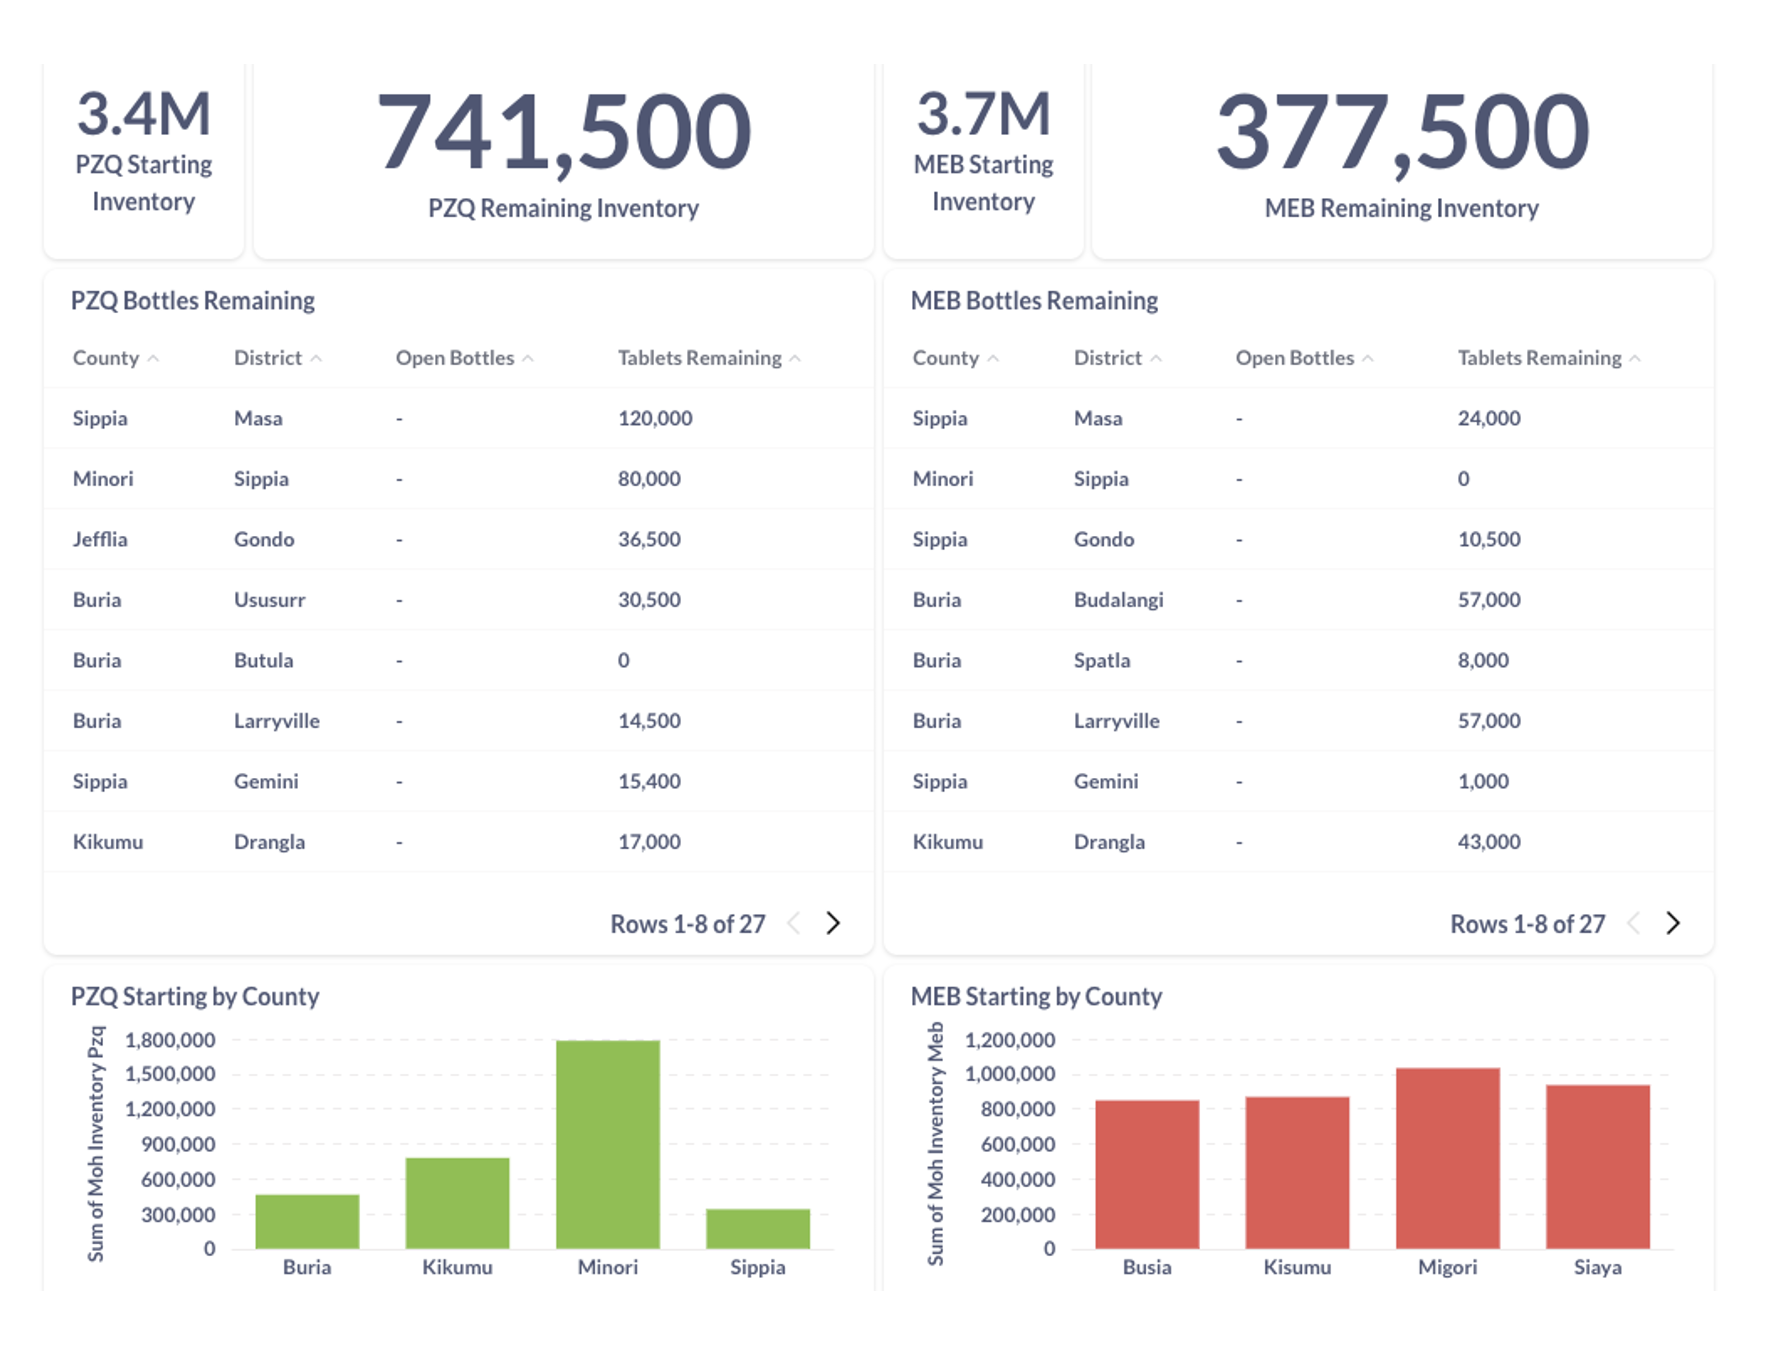
Dashboard example produced to report on drug used and remaining stock
8. Decision Support Artifacts
- These data are collected to determine quantities of drugs by Admin 2 (in Kenya this is the sub-county)
- The survey collects data on five donated medicines (DEC, ALB, PZQ, MEB, and IVM). For each medicine, the surveys asks for:
- On hand prior to the MDA (_prior_mda)
- Received for this MDA (_received)
- Remaining after the MDA and still in sealed bottles (_remaining_sealed)
- Remaining after the MDA, but in open bottles (_remaining_open)
- Batch number on the medicine bottle(s) (multiple_batches_)
Business rules:
- On hand prior to the MDA + Received for this MDA = total available medicines (per Admin 2 and drug)
- Remaining sealed + Remaining open = total remaining drug following the MDA (per Admin 2 and drug)
Reporting Specifications
XLSForm [link] is a widely used open standard that ensures consistent implementation of advanced features like skip logic across various web and mobile data collection platforms. Compatible platforms include:
- Open Data Kit (ODK)
- KoboToolbox
- Enketo Web Forms
- Ona
- SurveyCTO
- CommCare
- EpiCollect5
- Standard Data
Implementation & Integration
9. Digital Health Systems Integration
There are multiple opportunities for system integration between the tools presented here and national Health Information Management Systems (HMIS), Logistic Information Management Systems (LMIS), NTD databases or data repositories, and, at the global level, WHO and NTDeliver.
10. Monitoring & Evaluation Metrics
The key performance indicators (KPIs) for this tool are:
- Quantity of medical product(s) received
- Quantity of medical product(s) used
- Quantity of medical product(s) wasted
- Quantity of medical product(s) expired
- Quantity of medical product(s) remaining (calculated: received − (used + wasted + expired))
- Quantity of medical product(s) required for future treatments (calculated: needed − remaining)
Currently, inventory is reported once annually on the JAP annual reporting forms from countries to WHO. The tools presented here provide an opportunity to report quantities of medical products at the time of distribution, providing greater visibility and the opportunity to integrate these data into manufacturing forecast models.
References & Dependencies
11. WHO Guidelines & Resources
- WHO Smart Guidelines: Link
- WHO NTD Recommendations: Link
- Smart Guidelines References: Link
- Dependencies: Link